The Cisco Nexus™ 7000 Series Switches combine the highest levels of scalability with operational flexibility. The Cisco Nexus 7000 Series is a modular data center-class product line designed for highly scalable 10 Gigabit Ethernet networks with a fabric architecture that scales beyond 15 terabits per second (Tbps). Cisco® NX-OS Software, a state-of-the-art operating system, powers the Cisco Nexus 7000 Series platform. Cisco NX-OS is a data center-class operating system built with modularity, resiliency, and serviceability at its foundation. Cisco NX-OS helps ensure serviceability for mission-critical data center environments by providing a comprehensive set of features1, including a built-in protocol analyzer based on the popular open source Wireshark software.
This document begins with a brief introduction to the Wireshark protocol analyzer and describes the Wireshark-like functions provided by Cisco NX-OS. The document explains how to use the Wireshark protocol analyzer for real-time analysis of control-plane and data-plane traffic. This document also summarizes factors to consider when using this function and the effect it can have on Cisco Nexus 7000 Series supervisors' CPUs (Figure 1).
Figure 1. Cisco Nexus 7000 Series: Nexus 7018 and Nexus 7010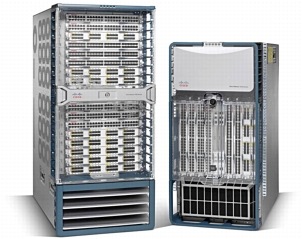
Wireshark, formerly known as Ethereal2, is the world's foremost network protocol analyzer and the standard across multiple industries and within many educational institutions. Wireshark development thrives thanks to the contributions of networking experts across the globe. Wireshark can interactively browse packet data from a live network or from a previously saved capture file. Wireshark's packet capturing is performed using the pcap library; its native capture file format is the libpcap format, which is also the format used by tcpdump and various other tools.
Wireshark's main window shows three views of a packet: a summary line briefly describes the packet type, the protocol field of interest can be shown and analyzed in the portion of the window directly below the summary line, and a hexadecimal dump shows exactly what the packet looks like when it goes across the wire. In addition, Wireshark has some features that make it unique; for example, it can assemble all the packets in a TCP conversation and highlight the ASCII data in that conversation. The display filters in Wireshark are powerful; more fields are filterable in Wireshark than in other protocol analyzers. Figure 2 shows an example of the Wireshark GUI.
Figure 2. Wireshark GUI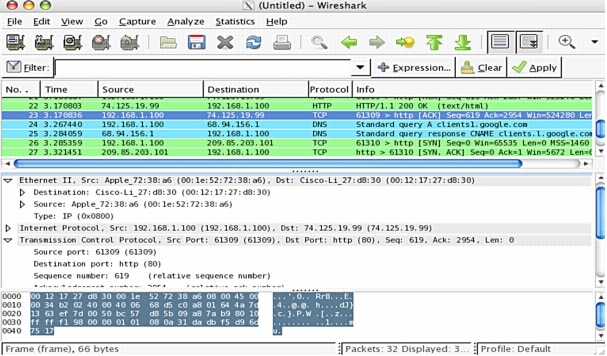
Network administrators often have difficulty gaining a complete knowledge of the nature of the control-plane traffic flowing through their network, but visibility into control-plane traffic is critical to full control over the network. For this reason, Cisco decided to embed a protocol analyzer within the Cisco NX-OS Software running on the Cisco Nexus 7000 Series Switches.
Cisco NX-OS is a modern, modular operating system running a Linux kernel (the MontaVista Linux 2.6.10 kernel). The architecture makes it easy to embed productive tools used by network administrators who are working in Linux-based environments. The most significant example of this integration is support for an integrated packet analyzer for the network traffic destined to or generated by the Cisco Nexus 7000 Series supervisor. Using the command-line version of Wireshark, called TShark (for Terminal Wireshark), as a basis, Cisco developed the Cisco NX-OS Ethanalyzer. The current version of TShark, on which the Cisco Ethanalyzer is based, is TShark Version 1.0.8, and the libpcap library is based on TShark Version 0.9.8.
Capturing and Analyzing Live Traffic on the Cisco Nexus 7000 Series Supervisor Ethanalyzer is available only in the default virtual device context (VDC)3. Ethanalyzer can interactively analyze packets being sent to (or generated by) the supervisor; more specifically, it can capture traffic received by the supervisor from both the out-of-band management port (mgmt0) and the I/O modules:
NX-OS# ethanalyzer local sniff-interface?
inband Inband/Outband interface
mgmt Management interface
NX-OS# ethanalyzer local sniff-interface?
inband Inband/Outband interface
mgmt Management interface
You cannot specify the explicit I/O module interface on which to perform the capture. As will be explained later in this document, however, you can configure capture filters that capture only traffic of interest.
After specifying where to capture traffic, you can choose among several Ethanalyzer options to specify how and what to capture:
NX-OS# ethanalyzer local sniff-interface inband ?
capture-filter Filter on ethanalyzer capture
decode-internal Include internal system header decoding
detailed-dissection Display detailed protocol information
display-filter Display filter on frames captured
dump-pkt Hex/Ascii dump the packet with possibly one line
summary
limit-captured-frames Max number of frames to be captured (dflt is 10)
limit-frame-size Capture only a subset of a frame
write Filename to save capture to
Capture only traffic to or from the particular IP address 172.16.7.3:
"host 172.16.7.3"
Capture traffic to or from a range of IP addresses:
"net 172.16.7.0/24" or "net 172.16.7.0 mask 255.255.255.0"
Capture traffic from a range of IP addresses:
"src net 172.16.7.0/24" or "src net 172.16.7.0 mask 255.255.255.0"
Capture traffic to a range of IP addresses:
"dst net 172.16.7.0/24" or "dst net 172.16.7.0 mask 255.255.255.0"
Capture only Domain Name System (DNS) traffic:
"port 53"
Capture traffic that is not HTTP or Simple Mail Transfer Protocol (SMTP) traffic:
"host 172.16.7.3 and not port 80 and not port 25"
Capture traffic except Address Resolution Protocol (ARP) and DNS traffic:
"port not 53 and not arp"
Capture traffic within a range of Layer 4 ports:
"tcp portrange 1501-1549"
Capture only Ethernet type Authentication Protocol over LAN (EAPOL) traffic:
"ether proto 0x888e"
Reject Ethernet frames belonging to the Link Layer Discovery Protocol (LLDP) multicast group:
"not ether dst 01:80:c2:00:00:0e"
• More capture filtering options are available from these resources:– http://wiki.wireshark.org/CaptureFilters
– http://www.tcpdump.org/tcpdump_man.html
• decode-internal: This option is for Cisco Technical Assistance Center (TAC) use only, as it does not provide any meaningful information to the network administrator.
• detailed-dissection: This option enables the user to see a detailed view of the captured packet. Every protocol field is decoded and presented in a clear and organized format for in-depth analysis. If this option is not specified, Ethanalyzer will print a summary line for each packet it captures; the line will show the most important protocol fields.
• display-filter: Ethanalyzer supports post-capture display filters. Here are some examples:
Show only SMTP (port 25) and ICMP traffic:
"tcp.port eq 25 or icmp"
Show only traffic in the LAN (172.16.x.x) between clients and servers:
"ip.src==172.16.0.0/16 and ip.dst==172.16.0.0/16"
The TCP buffer is full, so the source instructs the destination to stop sending data:
"tcp.window_size == 0 && tcp.flags.reset != 1"
Filter on Microsoft Windows; filter out noise while watching Microsoft Windows client and data center exchanges:
"smb || nbns || dcerpc || nbss || dns"
You can also search for characters appearing anywhere in a field or protocol by using the "matches" operator. For example, you can match packets that contains the 3-byte sequence 0x71, 0x6A, 0xE3 anywhere in the User Datagram Protocol (UDP) header:
"udp contains 71:6a:e3"
The "slice" feature is useful for filtering on the vendor's organizational unique identifier (OUI) of the MAC address; thus, you can restrict the display to only packets from a specific device manufacturer:
"eth.addr[0:3]==00:08:5A"
The use and syntax of the display filters are described in the Wireshark user's guide:http://www.wireshark.org/docs/wsug_html_chunked/ChWorkBuildDisplayFilterSection.html
• dump-pkt: This option causes Ethanalyzer to print a hexadecimal and ASCII dump of the packet data after printing a summary line that helps quickly identify the packet type.• limit-captured-frames: With this option, you can specify the number of packets to be captured. The default value is 10 packets. A value of zero tells the system to capture packets indefinitely until Ethanalyzer is explicitly stopped.
• limit-frame-size: This option specifies how many bytes of the packets will be displayed.
• write: This very useful option allows you to write the capture data to a file in one of the storage devices available on the Cisco Nexus 7000 Series Switch for later analysis. The capture file size is limited to 10 MB. When the capture data is saved to a file, the captured packets are not displayed in the terminal window. The display-write option will force Cisco NX-OS to display the packets while also saving the capture data to a file.
Here is an example of a live capture of Hot Standby Router Protocol (HSRP) packets reaching the Cisco Nexus 7000 Series supervisor:
NX-OS# ethanalyzer local sniff-interface inband capture-filter "net 10.16.16.0/24 and port 1985"
10 packets captured
2009-04-03 15:06:28.281 10.16.16.1 -> 224.0.0.2 HSRP Hello (state Active)
2009-04-03 15:06:28.371 10.16.16.2 -> 224.0.0.2 HSRP Hello (state Standby)
The entire packet and all its fields are displayed when the detailed-dissection option is part of the command:
NX-OS# ethanalyzer local sniff-interface inband capture-filter "net 10.16.16.0/24 and port 1985"detailed-dissection limit-captured-frame 1
< output omitted >
Internet Protocol, Src: 10.16.16.1 (10.16.16.1), Dst: 224.0.0.2 (224.0.0.2)
Version: 4
Header length: 20 bytes
Differentiated Services Field: 0xc0 (DSCP 0x30: Class Selector 6; ECN: 0x00)
1100 00.. = Differentiated Services Codepoint: Class Selector 6 (0x30)
.... ..0. = ECN-Capable Transport (ECT): 0
.... ...0 = ECN-CE: 0
Total Length: 48
Identification: 0x2435 (9269)
Flags: 0x00
0... = Reserved bit: Not set
.0.. = Don't fragment: Not set
..0. = More fragments: Not set
Fragment offset: 0
Time to live: 1
Protocol: UDP (0x11)
Header checksum: 0x9ab5 [correct]
[Good: True]
[Bad : False]
Source: 10.16.16.1 (10.16.16.1)
Destination: 224.0.0.2 (224.0.0.2)
User Datagram Protocol, Src Port: 1985 (1985), Dst Port: 1985 (1985)
Source port: 1985 (1985)
Destination port: 1985 (1985)
Length: 28
Checksum: 0x822b [correct]
[Good Checksum: True]
[Bad Checksum: False]
Cisco Hot Standby Router Protocol
Version: 0
Op Code: Hello (0)
State: Active (16)
Hellotime: Non-Default (1)
Holdtime: Non-Default (3)
Priority: 20
Group: 1
Reserved: 0
Authentication Data: Default (cisco)
Virtual IP Address: 10.16.16.3 (10.16.16.3)2009-04-03 15:06:33.334608
For those who can read hexadecimal code, the dump-pkt keyword provides a good exercise:
NX-OS# ethanalyzer local sniff-interface inband dump-pkt
Capturing on inband
00:24:f7:1d:b5:cf -> 01:00:0c:cc:cc:cd STP RST. Root = 24587/00:22:55:79:36:c1 Cost = 0 Port = 0x809c
0000 01 00 0c cc cc cd 00 24 f7 1d b5 cf 00 32 aa aa .......$.....2..
0010 03 00 00 0c 01 0b 00 00 02 02 3c 60 0b 00 22 55 ..........<`.."U
0020 79 36 c1 00 00 00 00 60 0b 00 22 55 79 36 c1 80 y6.....`.."Uy6..
0030 9c 00 00 14 00 02 00 0f 00 00 00 00 00 02 00 0b ................
To stop Ethanalyzer, press Ctrl-C.
Analyzing a Previously Saved Capture Ethanalyzer can decode previously saved captures stored in any of the storage devices available on Cisco Nexus 7000 Series Switches. The display options available for live captures are also available when reading a previously saved capture:
NX-OS# ethanalyzer local read usb2:2009-07-12_capture ?
detailed-dissection Display detailed protocol information
display-filter Display filter on frames captured
limit-captured-frames Maximum number of frames to be captured (default is 10)
limit-frame-size Capture only a subset of a frame
write Filename to save capture to
| Pipe command output to filter
On-Demand Analysis of Data-Plane Traffic Ethanalyzer is part of the software running on the supervisor, and its main design goal is the capture and analysis of the traffic directed to and generated by the supervisor. A Cisco Nexus 7000 Series Switch is a fully distributed forwarding system in which the hardware-based data plane is implemented in the I/O modules. The data traffic is not seen by the supervisor or by Ethanalyzer, because all traffic is forwarded by the I/O modules. However, the Cisco Nexus 7000 Series does provide a method for enabling Ethanalyzer to capture data traffic.
In this mode of operation, Ethanalyzer gives network administrators a powerful, easy-to-use tool that increases visibility into application behavior and increases their ability to exert control over the network environment.
Ethanalyzer can analyze application traffic on demand with a few simple steps:
1. Identify the application characteristics: for example, Layer 4 ports.2. Create an impromptu access control list (ACL) to match (and permit) the application flow between two known servers.
3. Add the "log" keyword to the Access Control Entries (ACEs) to send copies of the matching traffic to the supervisor. This mechanism allows the supervisor to receive the traffic of interest and allows Ethanalyzer to capture it.
4. Set the configurable hardware-based rate limiter, access-list-log, to limit the rate at which copies of the packets are sent to the supervisor. This function is extremely important because it protects the Cisco Nexus 7000 Series supervisor from the eventual high rates of the packet copies generated by the ACL logging mechanism.
If you want to capture and analyze the traffic at line rate, then Ethanalyzer is not the right tool; the Cisco Nexus 7000 Series provides other features such as NetFlow and Switched Port Analyzer (SPAN) that are designed explicitly for that purpose.
5. Now open a different terminal session to the Cisco Nexus 7000 Series Switch and start Ethanalyzer with the appropriate capture filters in place. No packets should be captured at this time, as the ACL has not been applied to any interface yet.6. In the original terminal window, now apply the impromptu ACL to the interfaces at which the traffic of interest is expected to be received.
After the ACL is in place, the forwarding engine will start to generate the copies of the matching traffic, while the original packets are forwarded with no effect on performance.
The copies allowed by the rate limiter will then reach the supervisor, where Ethanalyzer can easily capture and analyze them.
The following example illustrates how to implement these steps.
Consider an application using TCP port 5600 between server 1.1.1.1 and client 1.1.1.2. The first step is to create the impromptu ACL:
NX-OS(config)# ip access-list my-app
NX-OS(config-acl)# statistics per-entry
NX-OS(config-acl)# permit tcp host 1.1.1.1 host 1.1.1.2 eq 5600 log
NX-OS(config-acl)# permit tcp host 1.1.1.2 host 1.1.1.1 eq 5600 log
NX-OS(config-acl)# show ip access-list my-app
IP access list my app
statistics per-entry
10 permit tcp 1.1.1.1/32 1.1.2/32 eq 5600 log
20 permit tcp 1.1.1.2/32 1.1.1.1/32 eq 5600 log
The access-list-log hardware-based rate limiter is responsible for making sure that the copies of the matching traffic (generated by the logging mechanism) do not overwhelm the supervisor. The default value of the rate limiter is 100 packets per second (pps) and can be tuned by the network administrator. The rate limiting occurs on a per-forwarding-engine basis. This implies that if the ACL is applied to interfaces on different line cards, the rate of the copies will be N times the value of the rate limiter, where N is the number of forwarding engines serving the interfaces being analyzed. Cisco's recommendation is not to exceed 1000 pps of aggregated access-list-log rate-limited traffic.
The value of the rate limiter can be modified and shown as follows:
NX-OS# conf t
NX-OS(config)# hardware rate-limiter access-list-log 250
NX-OS(config)# show hardware rate-limiter access-list-log
Units for Config: packets per second
Allowed, Dropped & Total: aggregated since last clear counters
Rate Limiter Class Parameters
------------------------------------------------------------
access-list-log Config : 250
Allowed : 0
Dropped : 0
Total : 0
With the setting shown here, the supervisor will not receive more than 250 pps of copies from each forwarding engine.
On another terminal window, the network administrator can start Ethanalyzer:
NX-OS# ethanalyzer local sniff-interface inband capture-filter "port 5600" limit-capture-frame 0 write bootflash:my-app-capture
Capturing on inband
Capturing on inband
Going back to the previous terminal window, the ACL can now be applied to the desired interfaces:
NX-OS(config)# interface ethernet 1/1
NX-OS(config-if)# ip access-list my-app input
NX-OS(config-if)# end
The copy of the data traffic generated by the application is now being captured, and the capture is stored in the bootflash memory for later analysis.
Effect of Ethanalyzer on CPU Ethanalyzer is part of the software running on the supervisor. It is important to understand its effect to the supervisor's CPU. Testing has shown an increase in the supervisor's CPU utilization of just under 5 percent. The utilization can be decreased by 1 or 2 percent by saving the capture data in a file (by using the write option).
General Public License Considerations The copyrights to certain works contained in the Cisco NX-OS Software are owned by third parties and used and distributed under license. Certain components of this software are licensed under GNU General Public License (GPL) Version 2.0 or GNU Lesser General Public License (LGPL) Version 2.1. A copy of each license is available at:
• http://www.opensource.org/licenses/gpl-2.0.php• http://www.opensource.org/licenses/lgpl-2.1.php
Conclusion
Cisco NX-OS helps ensure serviceability for mission-critical data center networks by providing a comprehensive set of features, including a built-in protocol analyzer, Ethanalyzer, based on the popular open source Wireshark protocol analyzer.
Network administrators have difficulty gaining complete knowledge of the control-plane traffic that flows through their networks. Visibility into this critical component of every network environment is critical to attaining increased control over the network. Ethanalyzer provides a simple tool for analyzing the network traffic destined to and generated by the supervisor.